“Global Process Spectroscopy Market to reach a market value of USD 44.98 Billion by 2031 growing at a CAGR of 10.8%”
The Global Process Spectroscopy Market size is expected to reach $44.98 billion by 2031, rising at a market growth of 10.8% CAGR during the forecast period.
The increasing adoption of portable and on-site spectroscopy devices for rapid elemental analysis has strengthened the segment’s growth. This is fuelled by the growing need for material analysis, ore grading, and process optimization in metal extraction and refining. X-ray fluorescence (XRF), atomic absorption spectroscopy (AAS), and mass spectroscopy are crucial in identifying mineral compositions, detecting impurities, and optimizing metal recovery processes. Thus, the metal and mining segment attained 5% revenue share in the market in 2023.

The major strategies followed by the market participants are partnership as the key developmental strategy to keep pace with the changing demands of end users. For instance, In January, 2025, Shimadzu Corporation teamed up with SepSolve Analytical, a Scientific equipment supplier to enhance chemical analysis through a GCxGC–TOF MS system. This collaboration integrates SepSolve’s BenchTOF2 mass spectrometer and INSIGHT modulation systems with Shimadzu’s Nexis GC gas chromatograph, improving non-target screening of complex samples in various sectors like food, fragrance, and environmental analysis. Additionally, In December, 2024, Bruker Corporation teamed up with the Berlin Institute of Health, a Research institute at Charité (BIH) to advance spatial tissue typing technologies (MALDI imaging) for translational research and clinical trials. Their collaboration focuses on automating processes and developing multi-omics approaches for protein and glycan analysis, enhancing disease understanding and diagnostics.
Based on the Analysis presented in the KBV Cardinal matrix; Thermo Fisher Scientific, Inc. is the forerunner in the Process Spectroscopy Market. Companies such as Danaher Corporation, ABB Ltd., and Agilent Technologies, Inc. are some of the key innovators in Process Spectroscopy Market. In June, 2024, Agilent Technologies, Inc. teamed up with ePrep, an online program based on the PREP Approach to distribute the ePrep, ONE chromatography sample preparation workstation in select regions. The ePrep ONE automates end-to-end sample preparation using syringes, offering high reliability and accuracy. This collaboration enhances Agilent’s portfolio, enabling more efficient workflows in pharmaceutical, environmental, and food research, particularly mass spectrometry analyses.

The growing emphasis on maintaining high product quality and minimizing production defects is driving the adoption of process spectroscopy across various manufacturing industries. In sectors like pharmaceuticals, food & beverages, and chemicals, sstringent quality standards necessitate real-time monitoring solutions to detect deviations and ensure compliance with regulatory norms. Therefore, the rising demand for quality control and process optimization in manufacturing industries propels the market's growth.
Additionally, Governments and private organizations worldwide are increasing investments in research and development (R&D) to advance analytical technologies, including process spectroscopy. These investments focus on enhancing spectroscopic methods to improve accuracy, reduce analysis time, and enable more cost-effective production monitoring. In conclusion, growing investment in R&D and government support for analytical technologies propels the market's growth.
One of the major barriers to the widespread adoption of process spectroscopy is the high initial cost of equipment and system integration. Advanced spectroscopic instruments, such as Fourier-transform infrared (FTIR) and Raman spectrometers, require significant investment in hardware, software, and skilled personnel. The cost of integrating these systems into existing manufacturing lines can be prohibitive for small and medium-sized enterprises (SMEs), limiting their adoption. Hence, the high initial investment and maintenance costs of process spectroscopy systems are impeding the market's growth.

The leading players in the market are competing with diverse innovative offerings to remain competitive in the market. The above illustration shows the percentage of revenue shared by some of the leading companies in the market. The leading players of the market are adopting various strategies in order to cater demand coming from the different industries. The key developmental strategies in the market are Partnerships, Collaborations & Agreements.
Free Valuable Insights: Global Process Spectroscopy Market size to reach USD 44.98 Billion by 2031


Based on component, the market is characterized into hardware and software. The hardware segment garnered 74% revenue share in the market in 2023. This dominance can be attributed to the increasing demand for advanced spectroscopic instruments such as near-infrared (NIR), Raman, and Fourier-transform infrared (FTIR) spectrometers. These devices are crucial in real-time monitoring, quality control, and process optimization across pharmaceuticals, food & beverages, chemicals, and oil & gas industries.

On the basis of technology, the market is classified into molecular spectroscopy, mass spectroscopy, and atomic spectroscopy. The mass spectroscopy segment recorded 35% revenue share in the market in 2023. The segment’s growth is fuelled by its high precision in identifying complex molecules, making it a crucial tool in pharmaceuticals, biotechnology, forensic science, and environmental testing.
The molecular spectroscopy segment is further subdivided into NIR, FT-IR, Raman, NMR, and others. The Raman segment held 9% revenue share in the market in 2023. This segment's growth is driven by its non-invasive and label-free analysis capabilities, making it an essential tool in biomedical diagnostics, pharmaceuticals, nanotechnology, and material science.
Based on application, the market is segmented into polymer, oil & gas, pharmaceutical, food & agriculture, chemical, water & wastewater, pulp & paper, metal & mining, and others. The pulp and paper segment held 5% revenue share in the market in 2023. This is driven by the need for process control, quality assurance, and environmental compliance in the paper manufacturing industry. Spectroscopy techniques like NIR and FT-IR help monitor moisture content, fiber composition, chemical additives, and pollutant levels in pulp and paper production.

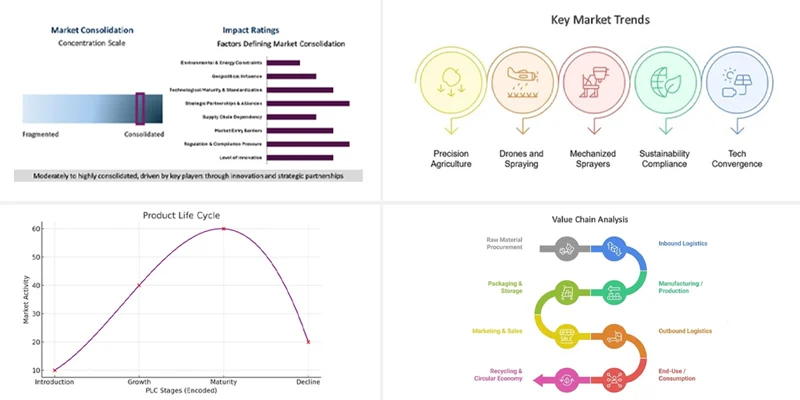
The Process Spectroscopy Market is highly competitive, driven by technological advancements, industry automation, and increasing demand for real-time process analysis. Key players focus on innovation, mergers, and acquisitions to expand market presence. Attributes influencing the market include precision, non-destructive analysis, speed, and adaptability to diverse industries such as pharmaceuticals, food & beverages, chemicals, and oil & gas. Integration of AI and IoT enhances spectroscopy applications, enabling real-time monitoring and predictive analytics, further fueling market growth and competition.
Region-wise, the market is analyzed across North America, Europe, Asia Pacific, and LAMEA. The Asia Pacific segment witnessed 24% revenue share in the market in 2023. Countries like China, Japan, and India have emerged as major contributors due to their expanding manufacturing, biotechnology, and environmental monitoring sectors. The rising demand for high-quality products, strict government regulations, and increasing adoption of automation in industries has accelerated the adoption of spectroscopy solutions.
| Report Attribute | Details |
|---|---|
| Market size value in 2023 | USD 20.17 Billion |
| Market size forecast in 2031 | USD 44.98 Billion |
| Base Year | 2023 |
| Historical Period | 2020 to 2022 |
| Forecast Period | 2024 to 2031 |
| Revenue Growth Rate | CAGR of 10.8% from 2024 to 2031 |
| Number of Pages | 333 |
| Number of Tables | 514 |
| Report coverage | Market Trends, Revenue Estimation and Forecast, Segmentation Analysis, Regional and Country Breakdown, Competitive Landscape, Market Share Analysis, Porter’s 5 Forces Analysis, Company Profiling, Companies Strategic Developments, SWOT Analysis, Winning Imperatives |
| Segments covered | Component, Technology, Application, Region |
| Country scope |
|
| Companies Included | ABB Ltd., Agilent Technologies, Inc., Bruker Corporation, BUCHI Labortechnik AG, Danaher Corporation, Horiba Ltd., Sartorius AG, Shimadzu Corporation, Thermo Fisher Scientific, Inc. and Yokogawa Electric Corporation |
By Component
By Technology
By Application
By Geography
This Market size is expected to reach $44.98 billion by 2031.
Rising Demand for Quality Control and Process Optimization in Manufacturing Industries are driving the Market in coming years, however, High Initial Investment and Maintenance Costs of Process Spectroscopy Systems restraints the growth of the Market.
ABB Ltd., Agilent Technologies, Inc., Bruker Corporation, BUCHI Labortechnik AG, Danaher Corporation, Horiba Ltd., Sartorius AG, Shimadzu Corporation, Thermo Fisher Scientific, Inc. and Yokogawa Electric Corporation
The expected CAGR of this Market is 10.8% from 2023 to 2031.
The Molecular Spectroscopy segment is leading the Market by Technology in 2023; thereby, achieving a market value of $20.18 billion by 2031.
The North America region dominated theMarket by Region in 2023, and would continue to be a dominant market till 2031; thereby, achieving a market value of $18.4 billion by 2031.
Our team of dedicated experts can provide you with attractive expansion opportunities for your business.

 Drivers
 Restraints
 Opportunities
 Challenges
